The Level Executive Summit brought together senior marketers, platform partners, and researchers for one full day of working sessions in Pittsburgh. Ten speakers. Six platforms. One CMU professor with a kingfisher slide that stopped the room.


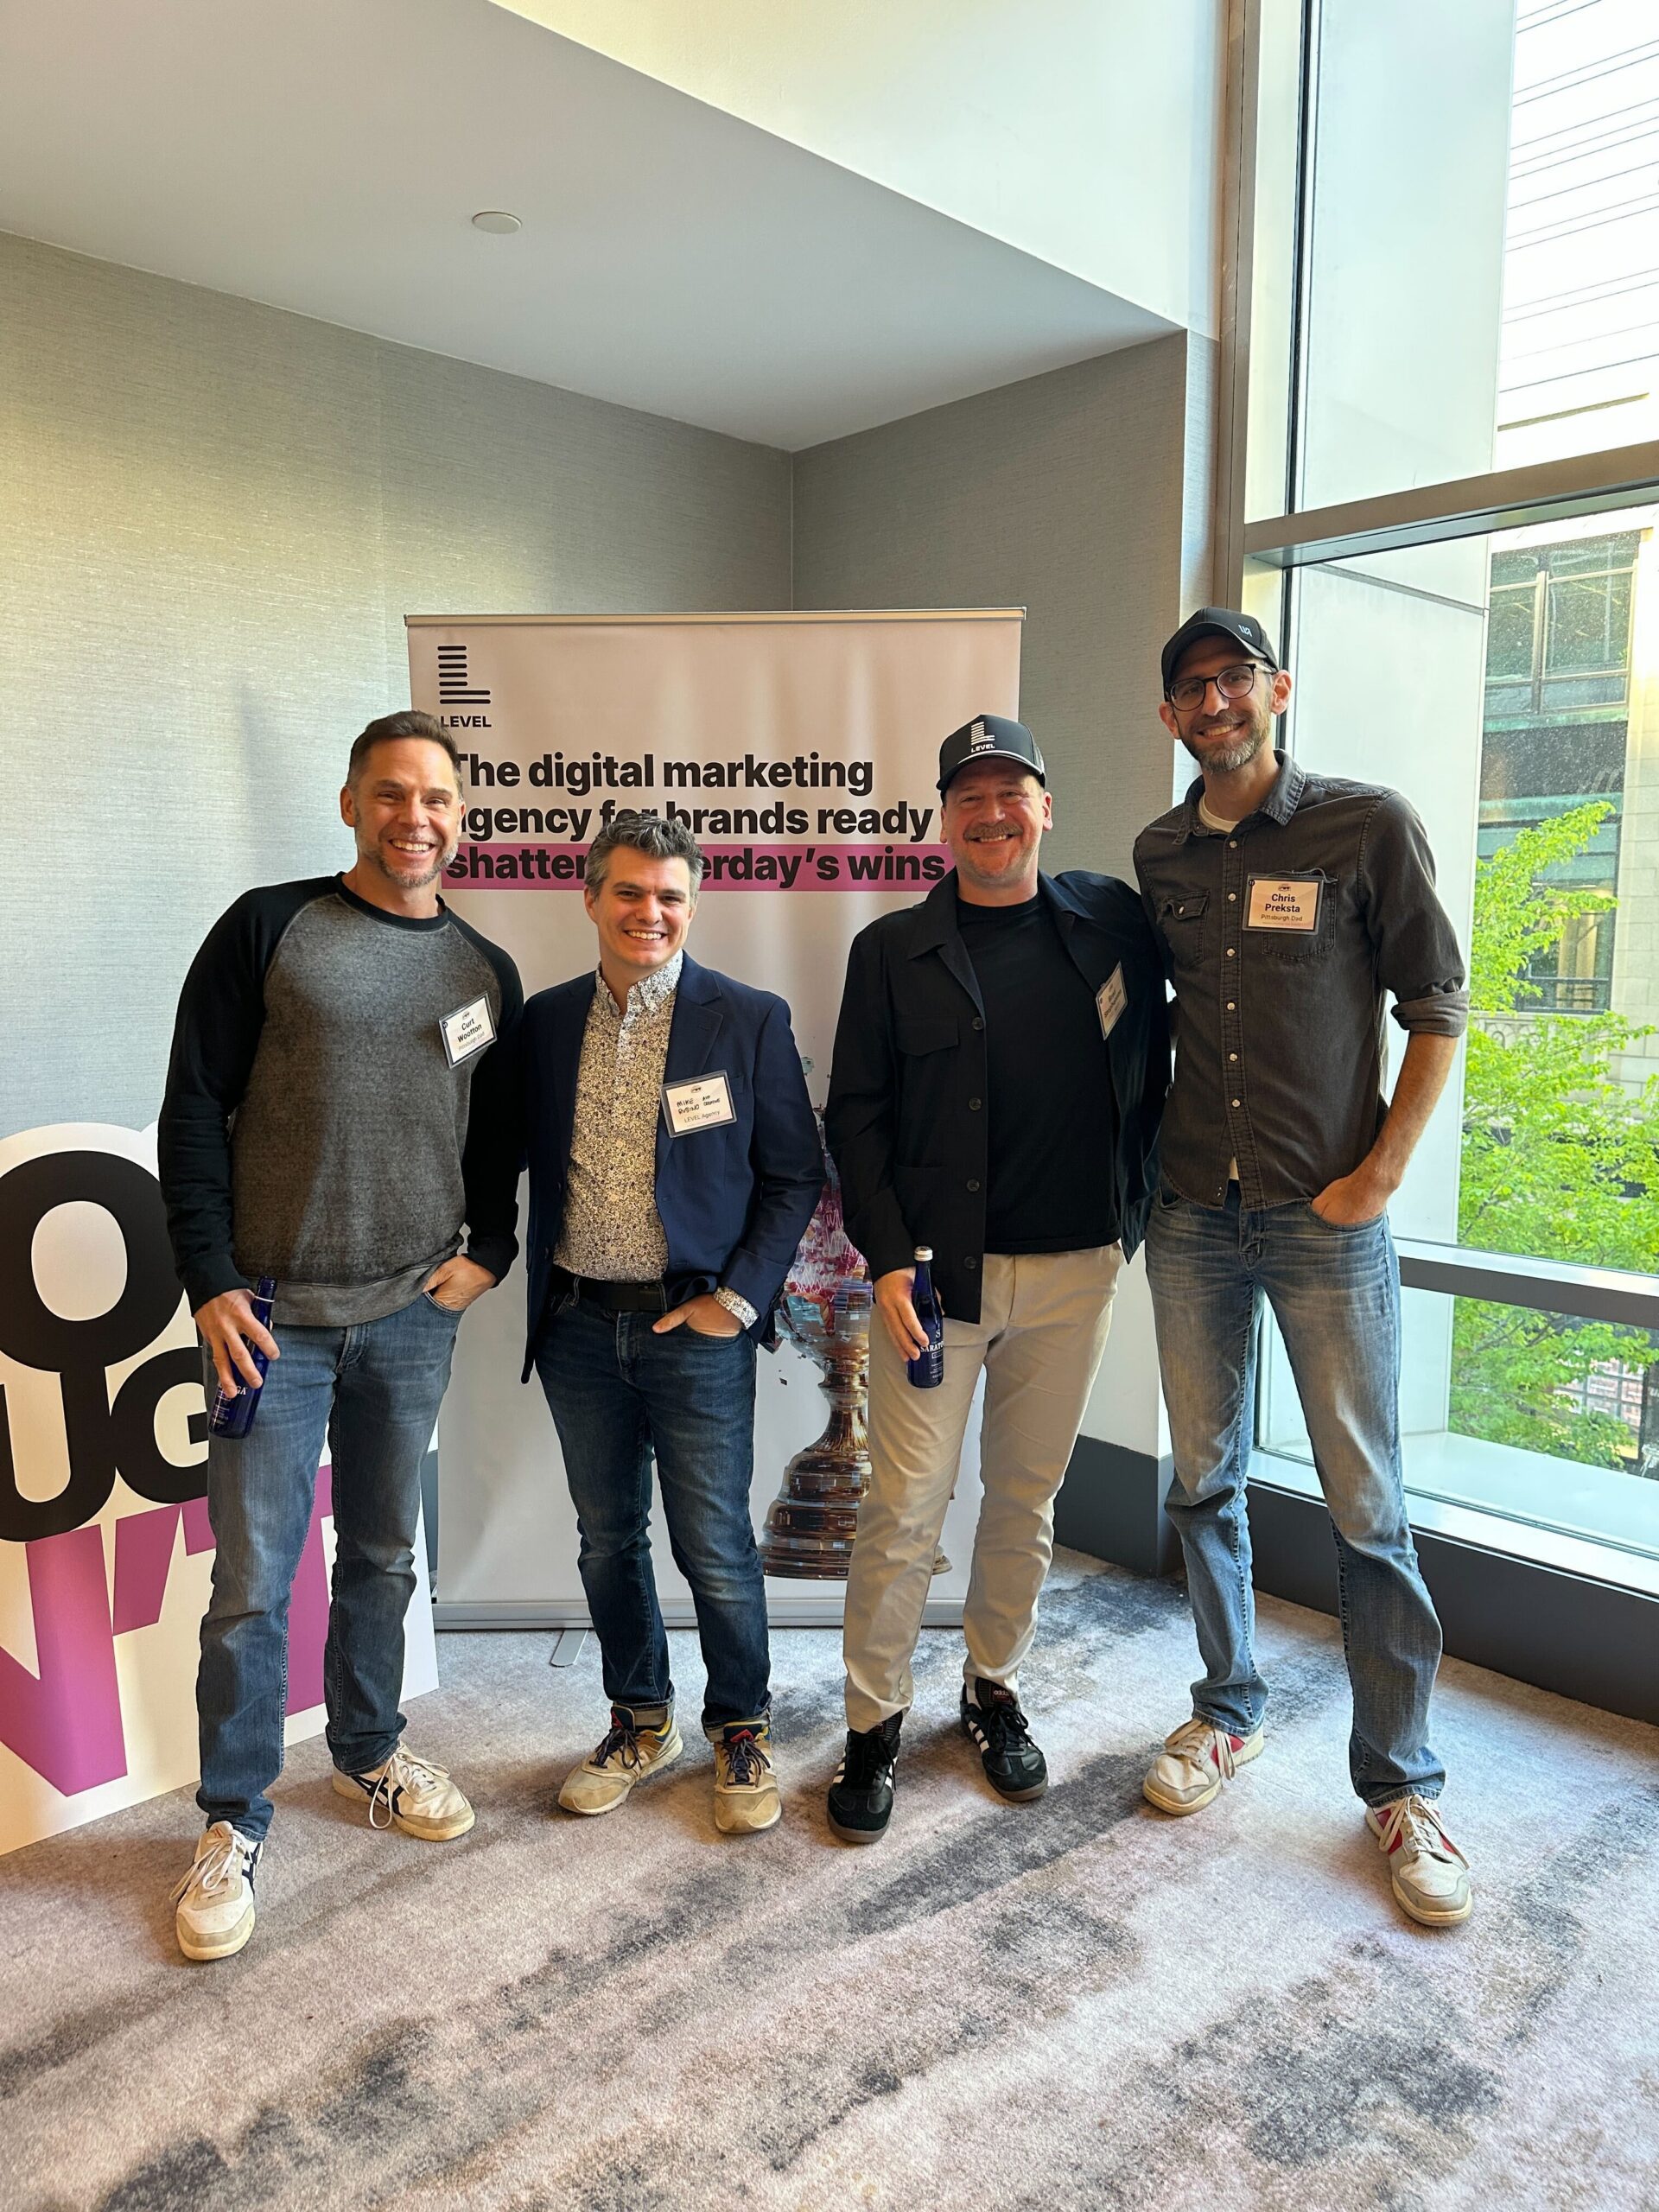

Attendees also caught the Pittsburgh Pirates at PNC Park on arrival day, then spent an evening with Second City, the legendary Chicago improv group, for a show and hands-on workshop at City Theatre in partnership with the venue. Turns out, spending time learning to think on your feet was a fitting end to a series of sessions about exactly that.
Here are the 2026 marketing insights that came out of it.
AI adoption is not the problem. Deployment is.
Prithwi Dasgupta, President of LeadSquared US, opened his session with a number that landed hard: 47% of companies abandoned most of their AI initiatives in 2025. The follow-up was sharper.
His diagnosis: organizations treated pilots as destinations. They built demos with clean data and controlled environments. Then they handed the technology to real workflows, and it broke. Consumers became the QA environment. Disconnected systems pulled from fragmented, out-of-sync sources and produced what Dasgupta called “confident nonsense,” resolving contradictions wrongly and presenting the result as fact.
The case studies were damning. Zillow’s AI home-valuation algorithm triggered a $569M writedown after overpaying for 7,000+ homes. UnitedHealth’s AI auto-denied Medicare claims with a 90% error rate on appeal. McDonald’s and IBM scrapped an AI voice ordering system after a three-year pilot at 100+ drive-throughs. In every case, the failure was not the technology. It was deployment without a defined outcome.
The principle Dasgupta left the room with: Tentatively Right beats Confidently Wrong. Before deploying AI, define the outcome it owns. If you cannot name the metric before you start, the pilot will not scale.
Audit every AI initiative currently in flight against one question: what specific outcome is it accountable for? “Efficiency” and “productivity” are not specific enough. Name the metric, the baseline, and the measurement window before you expand.
Measurement has to prove causation, not just report correlation
Google’s Alana Parsons and Chris Marino built their session around a car metaphor that held up all day: data is the fuel, causality is the gauges, and better decisions are the driving. You can have a Ferrari, but low-quality fuel means you lose the race before you start.
Most measurement today is a speedometer. It tells you what is happening. What marketers actually need is a wind tunnel: the ability to prove why it happened.
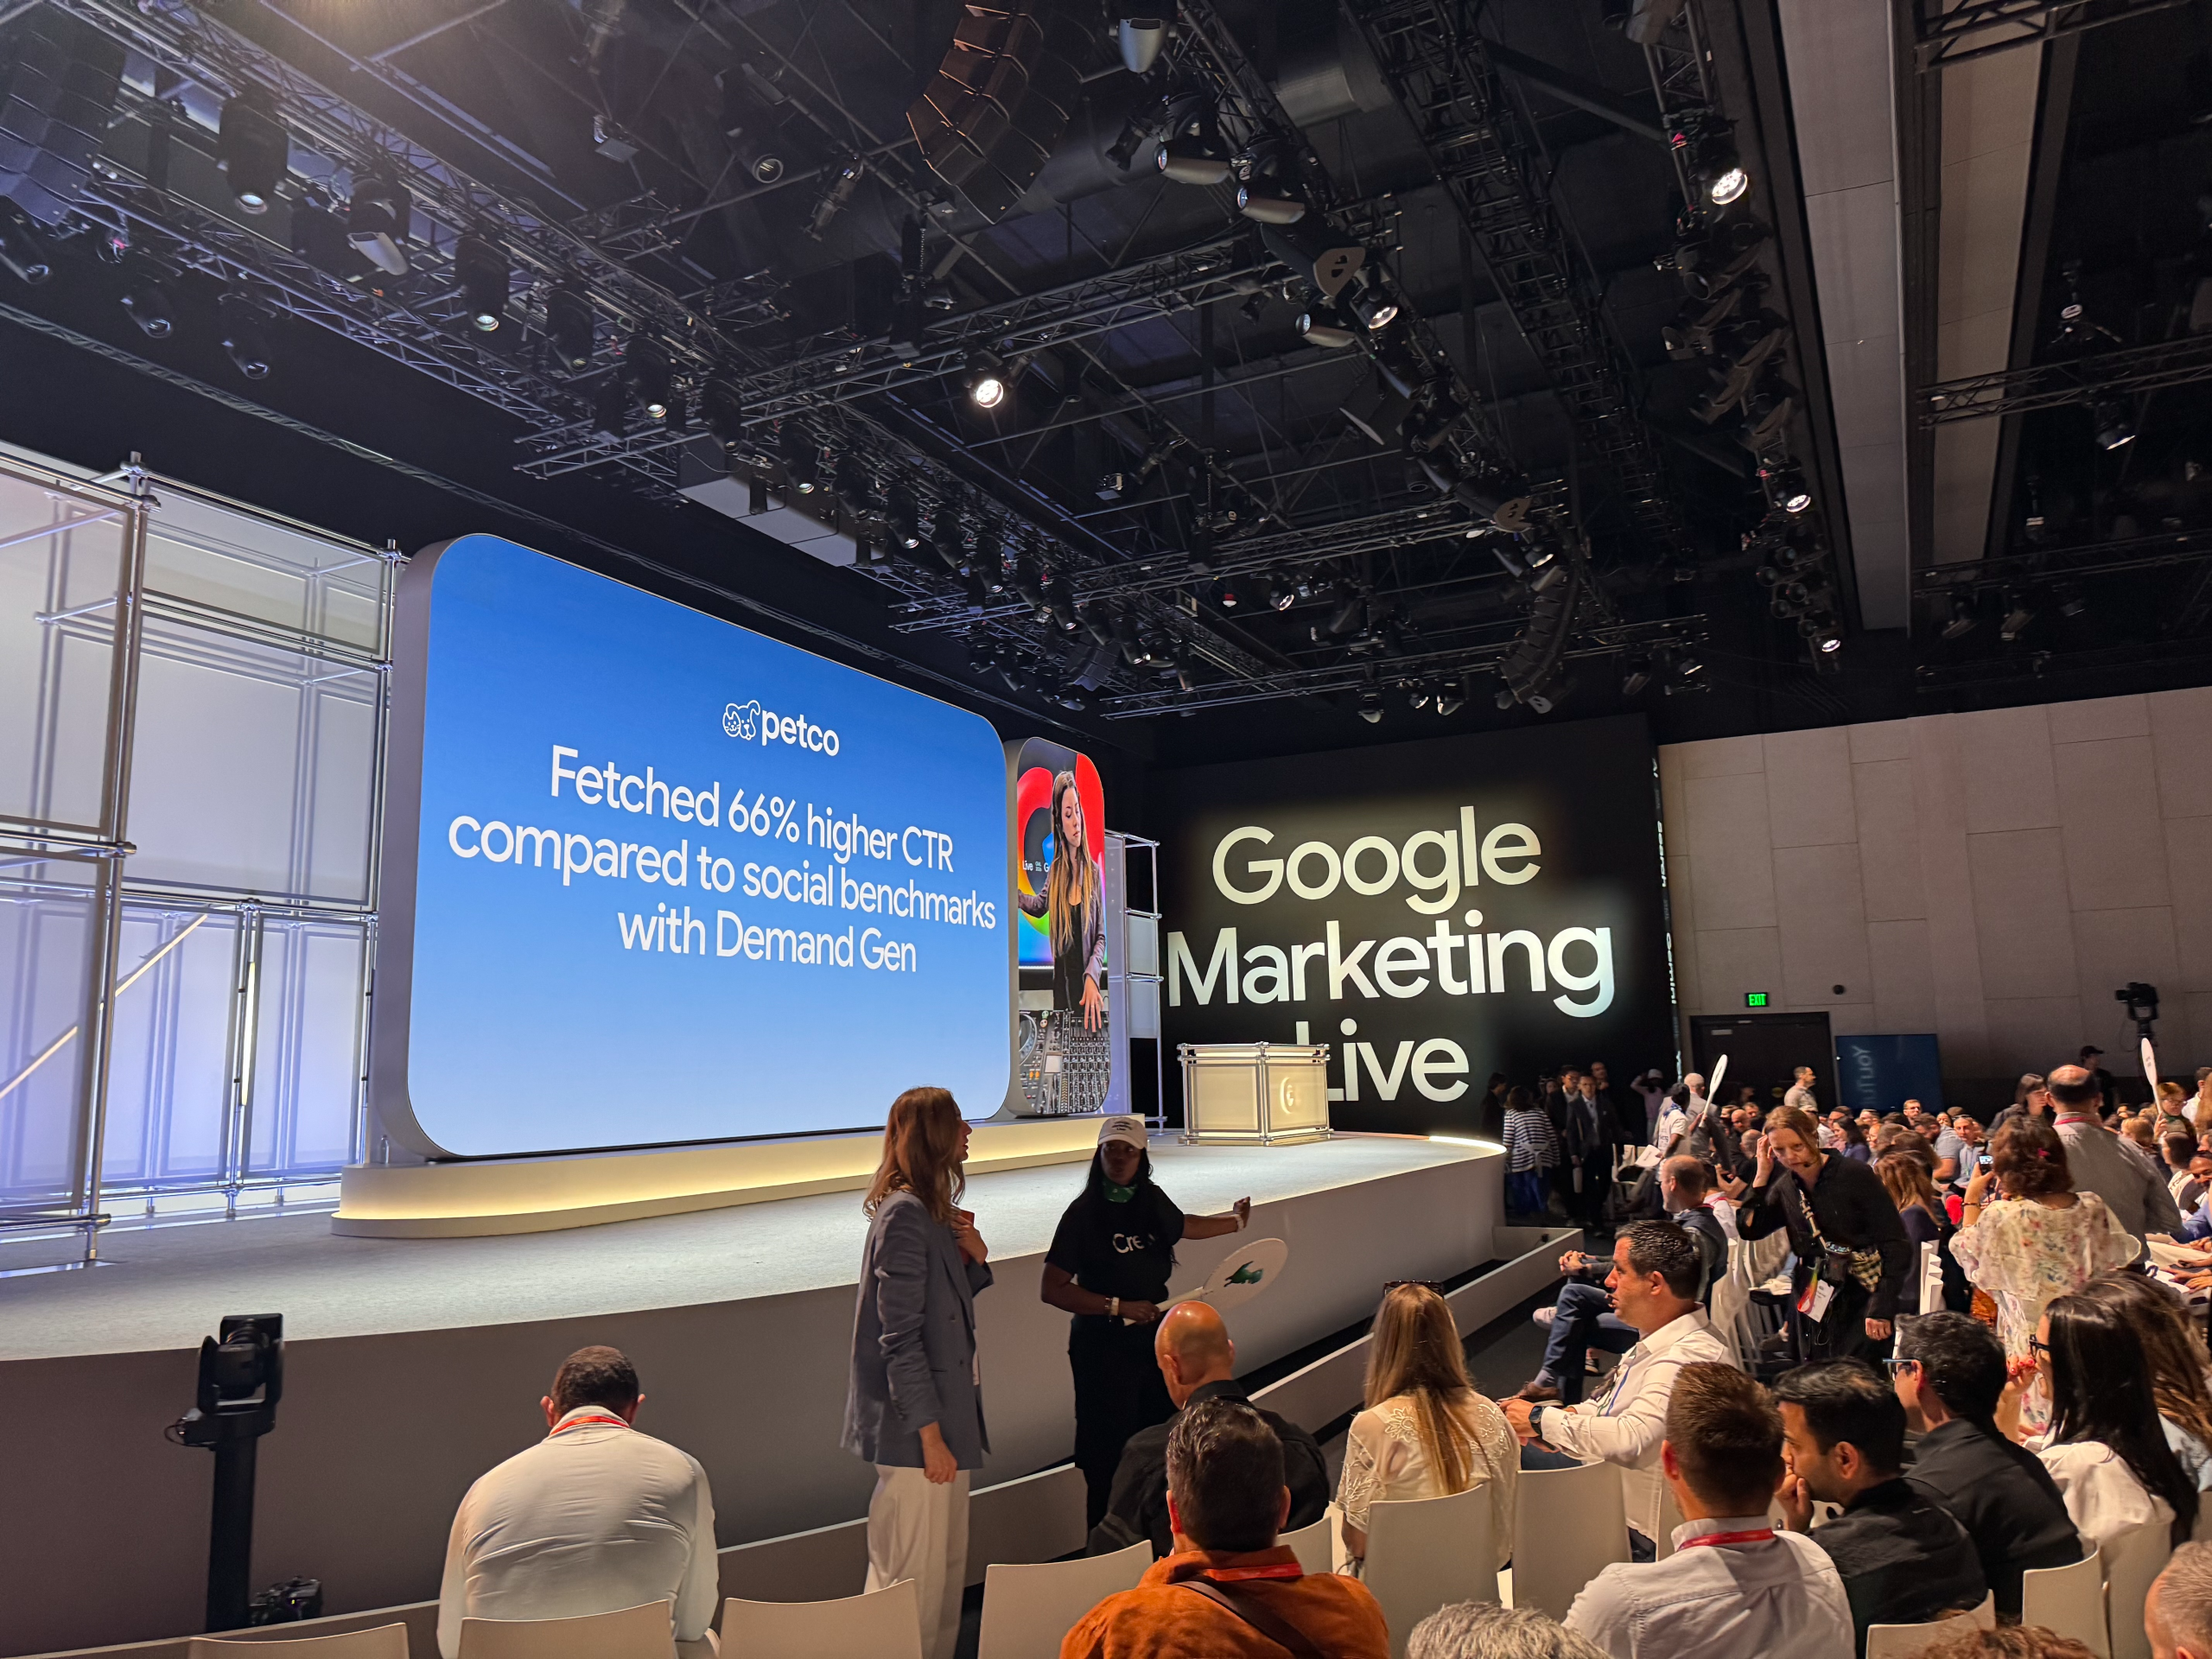
Level Agency is one of the first agency partners to deploy Google’s Causmos externally, a no-code tool for automated Causal Impact analysis. When a financial services client questioned upper-funnel YouTube spend, Level paused the campaigns and ran a causal analysis.
That is not attribution data. That is proof. Level.Signal extends this logic to lead quality, scoring every inbound lead in real time and feeding those scores back to Google’s bidding algorithm, redirecting spend from cheap form fills toward high-LTV customers.
Stop presenting last-click attribution data as proof of value. Add one causal test to your 2026 measurement plan. Pick a channel leadership has questioned, define the KPI, and run a hold-out or Causal Impact analysis. The result will be more persuasive in a CFO review than any attribution report you have ever produced.
Creative is now your targeting
Jeff Sikaitis, Head of Agency at Meta’s Global Business Group, did not lead with brand building. He led with media efficiency, and the data backed him up.
The reason this matters now is Meta’s Andromeda algorithm. Andromeda matches ads to users based on creative signals. When your creative library lacks genuine diversity, the algorithm groups similar assets into the same Entity ID and treats 30 ads like 10. You pay more, reach less, and learn nothing.
What does NOT count as creative diversity:
- Swapping backgrounds or making minor color changes
- Copying the same message with a different logo placement
- Using the same layout template with different copy
What does count: multiple angles, multiple audiences, multiple messages, different visual styles, different storytelling approaches, different voices.
Sikaitis introduced the Creative Operating System framework. The optimal ad set includes at least one image (1:1 or 4:5), one video (1:1 or 4:5), and one vertical video with audio (9:16). That combination alone produces 9.1% lower CPA. Using at least one Advantage+ creative enhancement produces 13% higher ROAS, 16% lower CPA, 29% higher conversion rate, and 11% higher reach.
Level.Prism connects directly to this framework, analyzing top and underperforming creative assets to identify what is working before you scale budget behind it.
Audit your current creative library against the Optimal Mix. If you do not have a 9:16 vertical video with audio in rotation, create one this month. Then map your concepting process: are you briefing by demographics or by motivators? If your brief says “target women 25-34,” rewrite it around a behavioral driver.
The purchase journey starts on Reddit and ends in an AI answer
Carly Steuck from Reddit presented a stat that reframed the platform for every B2C and considered-purchase brand in the room: Reddit is the #1 most cited domain across AI models. It is also the 7th most searched term on Google in the U.S.
The audience data makes the incremental reach argument. 69% of Redditors are not on LinkedIn. 62% are not on Instagram. Adding Reddit to the media mix produces +14% lift with search, +11% with social, and +5% with video.
Run a Reddit search audit for your brand and your two closest competitors right now. Search your brand name, your product category, and your top competitors’ names. What concerns surface repeatedly? That is your content gap map and your objection-handling guide. If no one is managing that narrative, someone else is.
Want to go deeper? Check out the insider session we did with Reddit in March 2026.
Innovation comes from looking sideways
Dr. Aniket Kittur of Carnegie Mellon University’s Human-Computer Interaction Institute brought the most unexpected session of the day, and the most memorable example.
In 1994, Eiji Nakatsu, a bullet train engineer and birdwatcher, solved the Shinkansen’s sonic boom problem by studying the kingfisher. The bird’s beak transitions between air and water with almost no splash. He redesigned the nose of the train on that principle: 15% less electricity, faster speeds, quieter entry.
The point was not about birds. AI trained on existing solutions produces more existing solutions. Left unchecked, it generates the average of what came before. Kittur showed a grid of app designs generated by AI tools that were nearly identical. Not because the tools are bad. Because they search where they already know.
His team at CMU built BioSpark to solve this, using AI to search nature’s solved problems and surface structural analogies for human design challenges. The results were clear: participants given cross-domain analogies produced 2x more high-quality ideas, and creative adaptation from a different domain was 5.4x more frequent with analogical search than with keyword search. His SMART framework for analogical innovation: Search at scale, Map to the target domain, Adapt with human expertise, Refine and iterate, Test viability.
In your next strategy session, run one analogical exercise. Pick a performance challenge your client faces. Then ask: what industry outside this one has already solved a version of this problem? The answer is never in the competitive benchmark.
AI without new process just fails faster
Patrick Patterson, Level’s CEO, delivered the keynote that tied the day together. The question he put to the room: what is your AI strategy? His answer: that is the wrong question. The right question is, what is your strategy, and how can AI enable it?
His argument was structural. Tools automate tasks. Systems learn from outcomes. Stacking AI on a fragmented process does not fix the process. It fails faster at scale.
The Level Marketing Operating System has four interconnected layers, each feeding the next:
The results from the system running together: creative turnaround dropped from 8+ days to under 24 hours, a 93% reduction. Application rate lift of 68% via Signal. 80% AI-assisted coding adoption with 29% time savings.
Map your current AI usage against the five maturity phases. Tools you have bolted onto existing workflows are Phase 2. Identify one process that needs to be rebuilt from the ground up for AI, not adapted. That is where Phase 4 starts.
Pittsburgh’s reinvention asks who gets to come along
Tammy Thompson, President and CEO of Catapult Greater Pittsburgh, gave the session that widened the lens on everything else. Pittsburgh has reinvented itself more than once: steel to industrial collapse, to eds and meds, to robotics and tech, and now to AI. Each reinvention created real opportunity. Historically, that opportunity was not distributed equally.
Thompson’s personal story illustrated the psychology of poverty in a way that stayed with the room. Poverty shapes decision-making. It shapes confidence and risk tolerance. It shapes whether people believe opportunity includes them.
Her AI bias demonstration was direct: she showed what ChatGPT generates when asked to depict a low-income community in Pittsburgh. The images reinforced racial and socioeconomic stereotypes. Not because the tool intended harm. Because it learned from data that encoded harm.
For marketers, the implication is operational. When AI-driven targeting systems learn from historical campaign data, they learn from historical biases too. The marketers building and deploying these systems are upstream of the output. What gets fed in shapes what comes out, at scale.
Add one question to your AI review process: whose data trained this model, and who does its output exclude? This is not just an ethics question. It is a performance question. AI systems that systematically exclude segments miss reach, produce brand risk, and fail to serve markets that are growing faster than the ones they optimize for.
The open internet is underinvested by two-thirds
The programmatic panel brought together John Ferraro from The Trade Desk, Kyle Dozeman from Pubmatic, and Brendan Clifford from Untapped Growth around one number.
The quality perception issue that held programmatic back for years has largely resolved. Premium publishers, CTV inventory, and quality curation tools have changed the landscape. The supply chain is also evolving: The Trade Desk has pushed into supply with OpenPath, and SSPs like Pubmatic are building demand-side tools. The panel disagreed on whether that convergence is healthy, but agreed it benefits advertisers through better transparency, lower fees, and improved access.
Pull your last 90 days of spend by channel. Calculate what percentage went to the three walled gardens versus everything else. If it is above 70% walled garden, run a programmatic test on the open internet this quarter. Start with CTV if your audience skews to streaming. The inventory is there.
LinkedIn video is a full-funnel B2B tool, not a brand awareness add-on
Mike Niesz, LinkedIn’s Senior Video Solutions Lead, reframed what LinkedIn video is for. The B2B buying journey now averages 10 stakeholders and 9 months. 94% of buying groups use AI search before talking to sales.
LinkedIn’s confidence thesis: scale does not secure B2B sales. Confidence does. Video-warmed members are 1.6x more likely to open a lead gen form. LinkedIn’s ROAS is 121% at the company level, higher than any other platform in their data. The CTV product is new: LinkedIn CTV Ads now available programmatically through The Trade Desk, bringing first-party professional targeting to streaming environments.
For any B2B client with a buying group of three or more, map every stakeholder role against your current media plan. Are you reaching the economic buyer, the end user, and the IT approver? If your campaign only targets the primary contact, you are losing deals to brands that reached the whole room.